Monitoring
The application comes with Prometheus support for monitoring. Metrics are exposed at /metrics endpoint.
Sample Prometheus scraper config
- job_name: overload-k8s
  honor_timestamps: true
  scrape_interval: 5s
  scrape_timeout: 1s
  metrics_path: /metrics
  scheme: http
  kubernetes_sd_configs:
  - api_server: <k8s-api-server>
    role: endpoints
    namespaces:
      names:
      - default
    selectors:
    - role: endpoints
      field: metadata.name=overload
Histogram
Check Prometheus HISTOGRAMS AND SUMMARIES.
By default, the application uses (20, 50, 100, 300, 700, 1100) as buckets to calculate response time quantiles. But each service has difference requirements, so the application provides a way to configure buckets in the test request itself.
Test endpoint accepts an array field histogramBuckets. Users can use this field to configure
their own criteria. Currently, the field allows any number of buckets, but it's advisable not to
use more than six buckets.
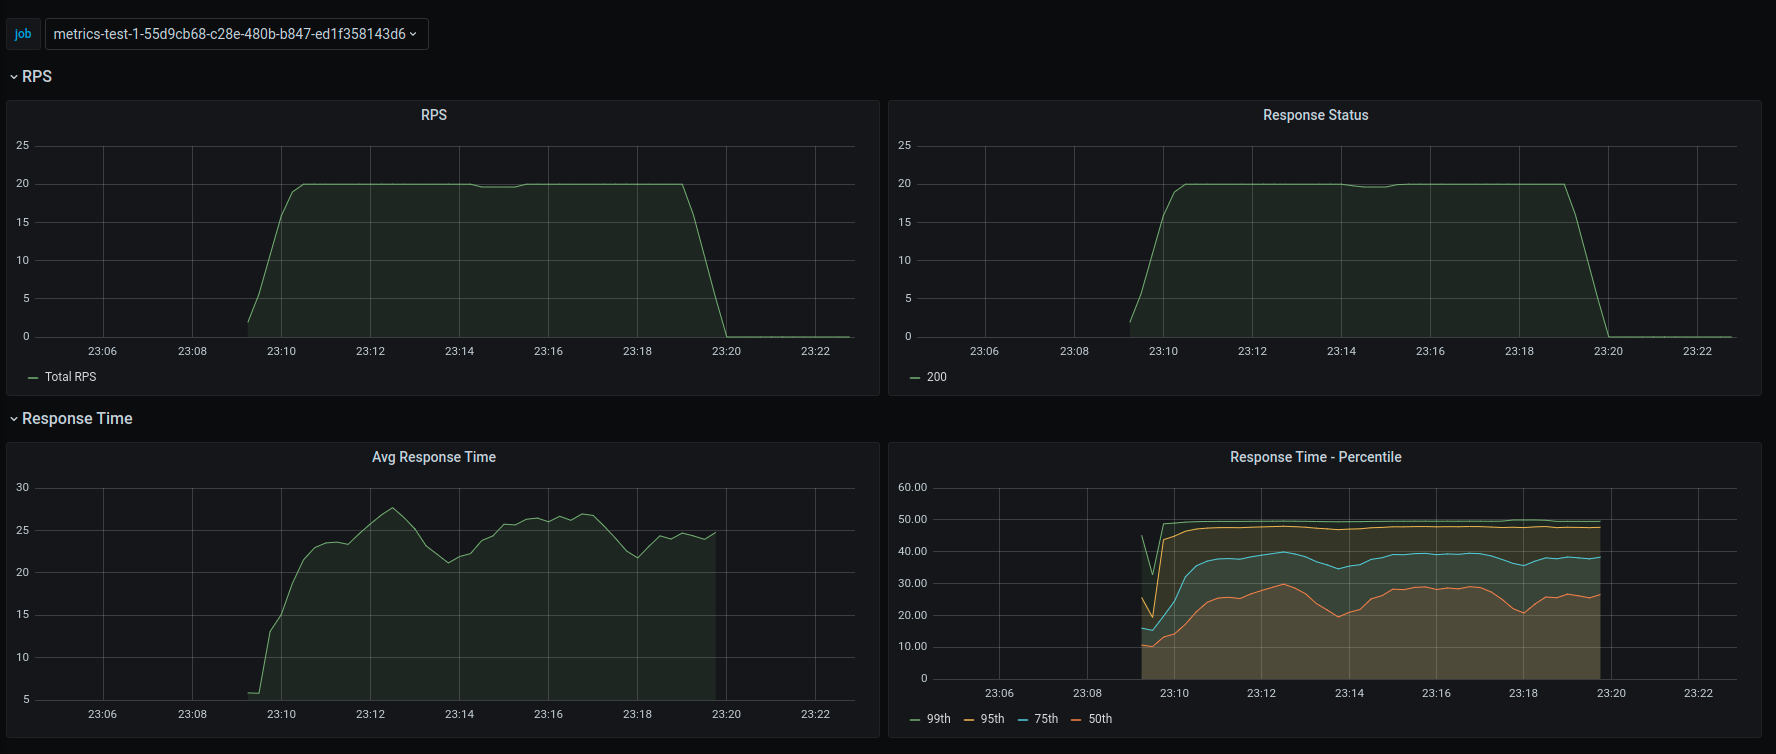
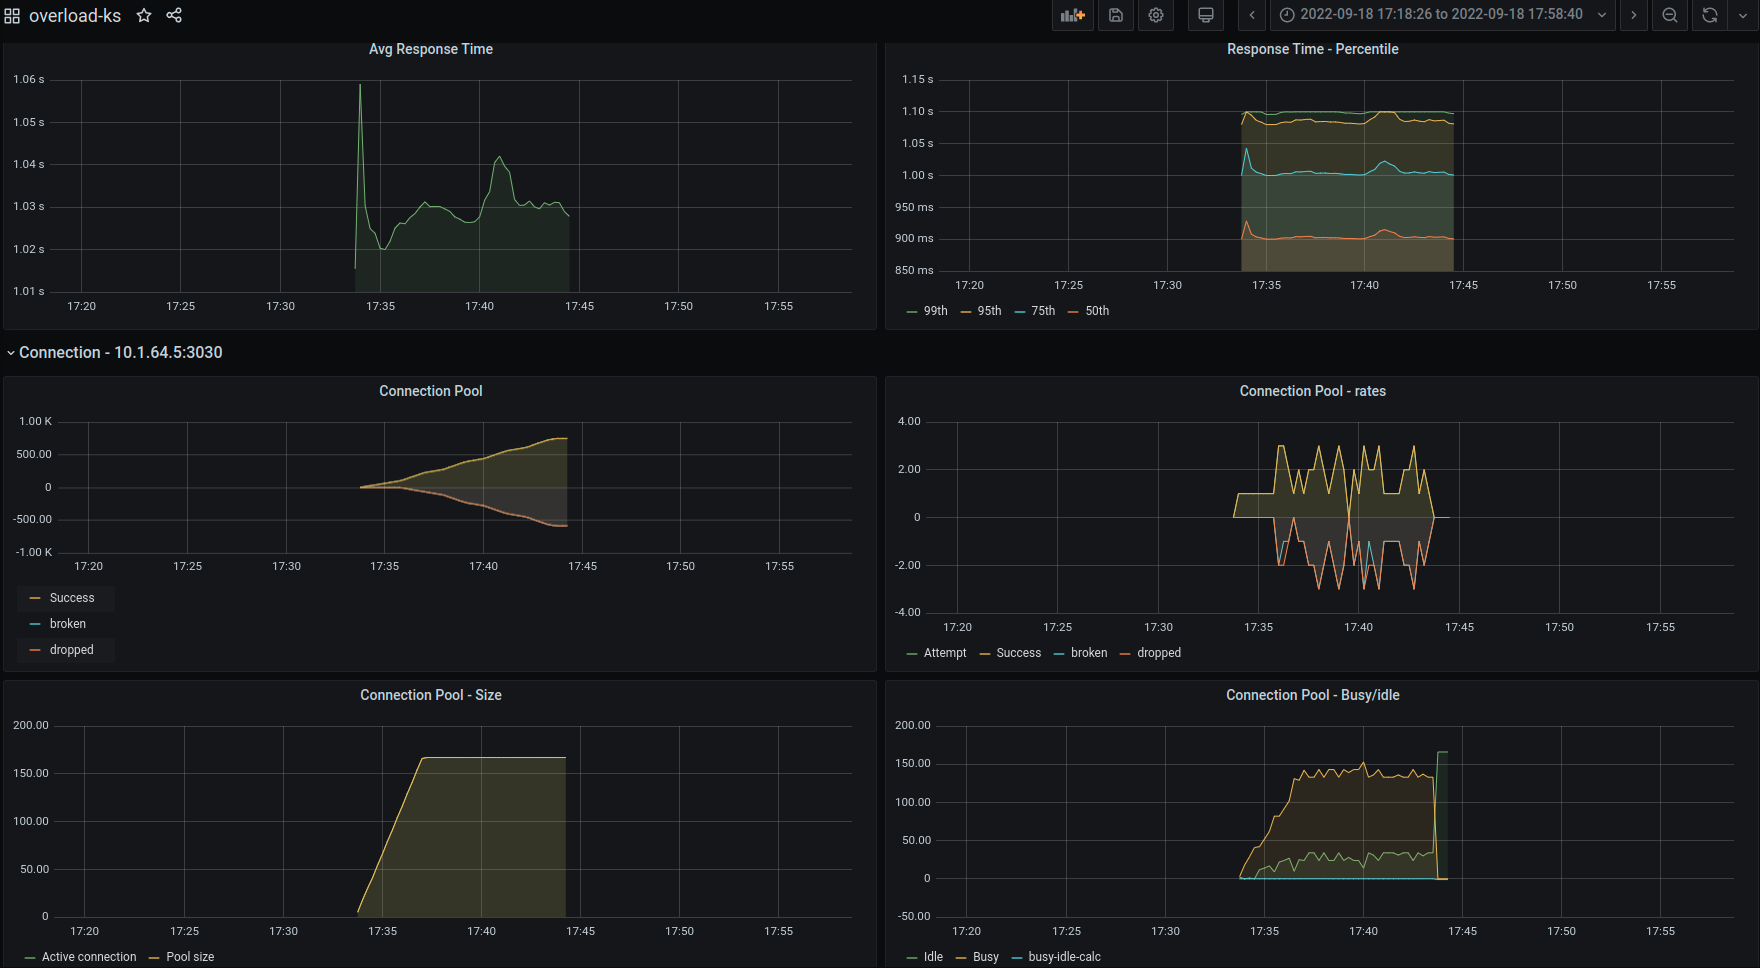
Grafana Dashboard
The application provides sample Grafana dashboard that can be used for monitoring. It has graphs for Request Per Seconds, Response Status count, Average response time and Response time quantiles.